Sync runs
Activity is the record of every sync run across your pipelines. As the page puts it: “Failures surface here first — drill in to see which chunks failed and why.”
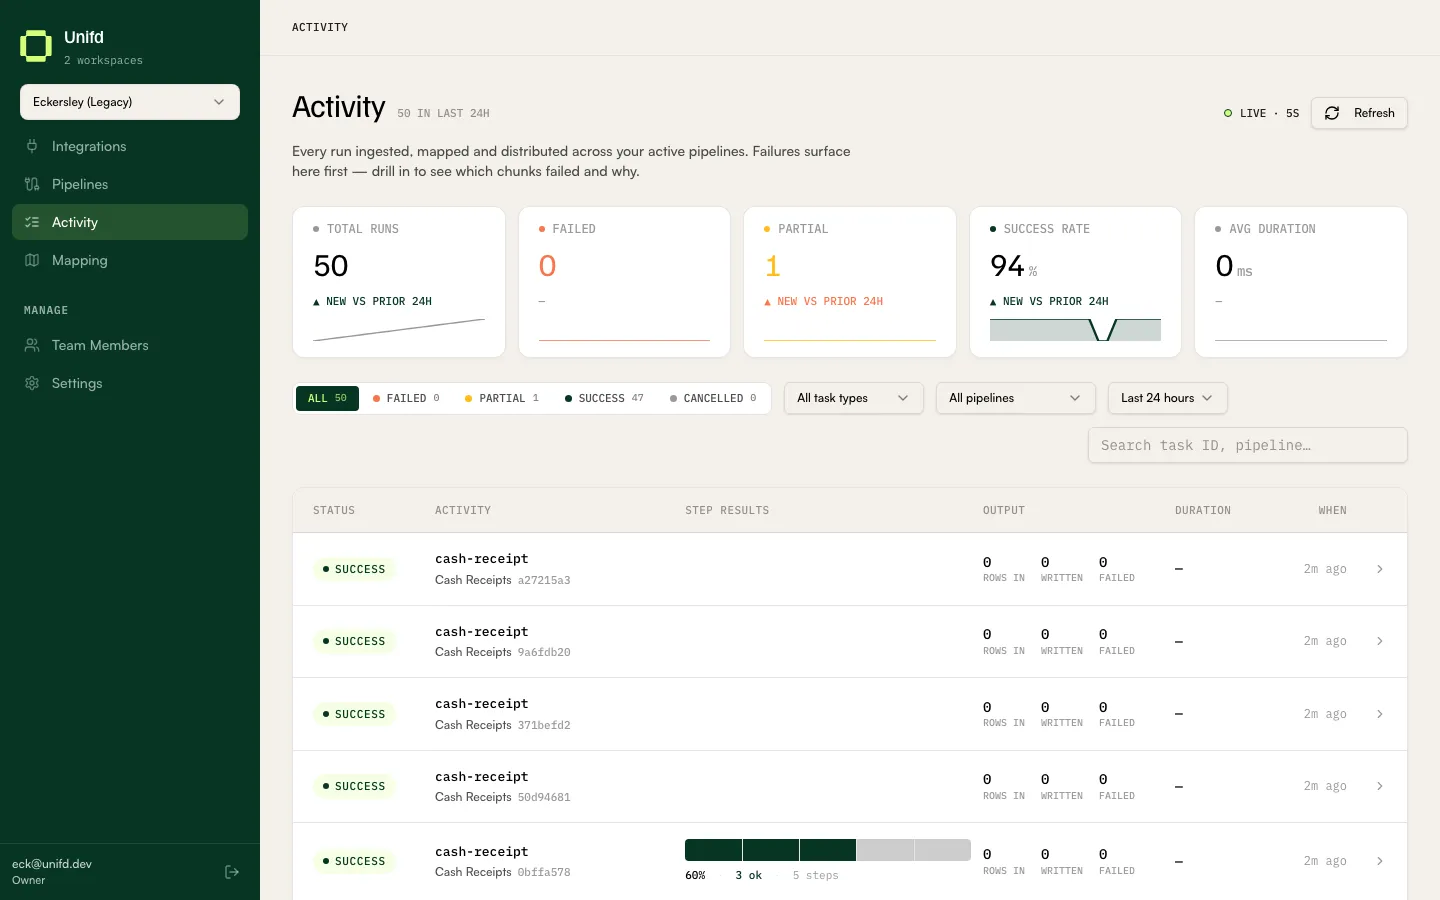
It refreshes itself every few seconds — the Live badge in the header says so —
and there is a Refresh button if you want to force it.
The last 24 hours at a glance
Section titled “The last 24 hours at a glance”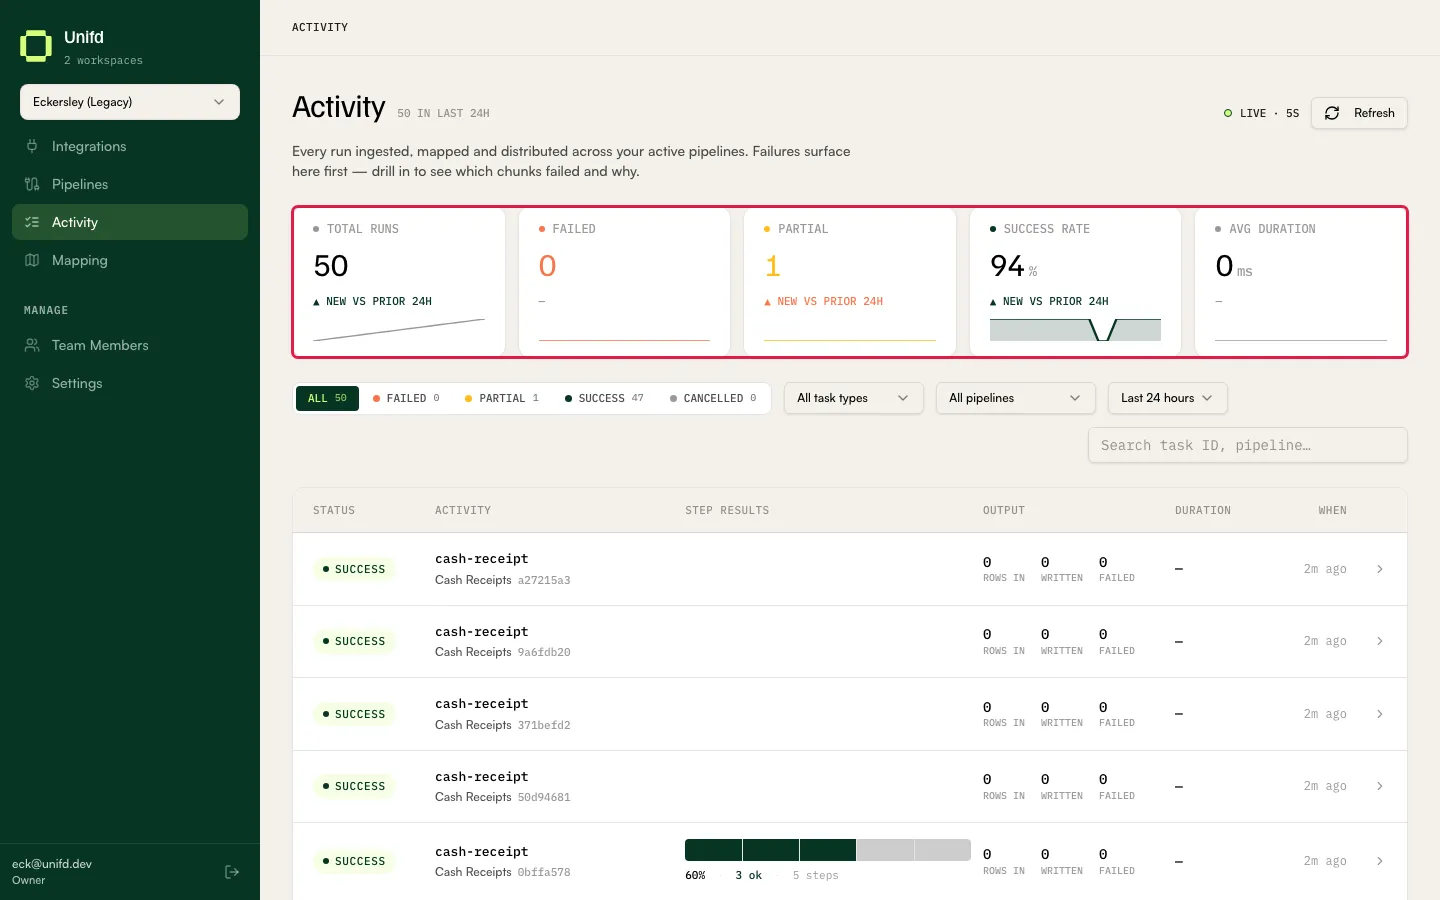
Five tiles summarise the period you have selected, each with a comparison against the previous 24 hours: Total runs, Failed, Partial, Success rate and Avg duration.
Duration is not always recorded. Plenty of healthy runs show
—for duration, and Avg duration can read0msas a result. Judge a run by its status and its output figures, not by its duration.
Narrowing the list
Section titled “Narrowing the list”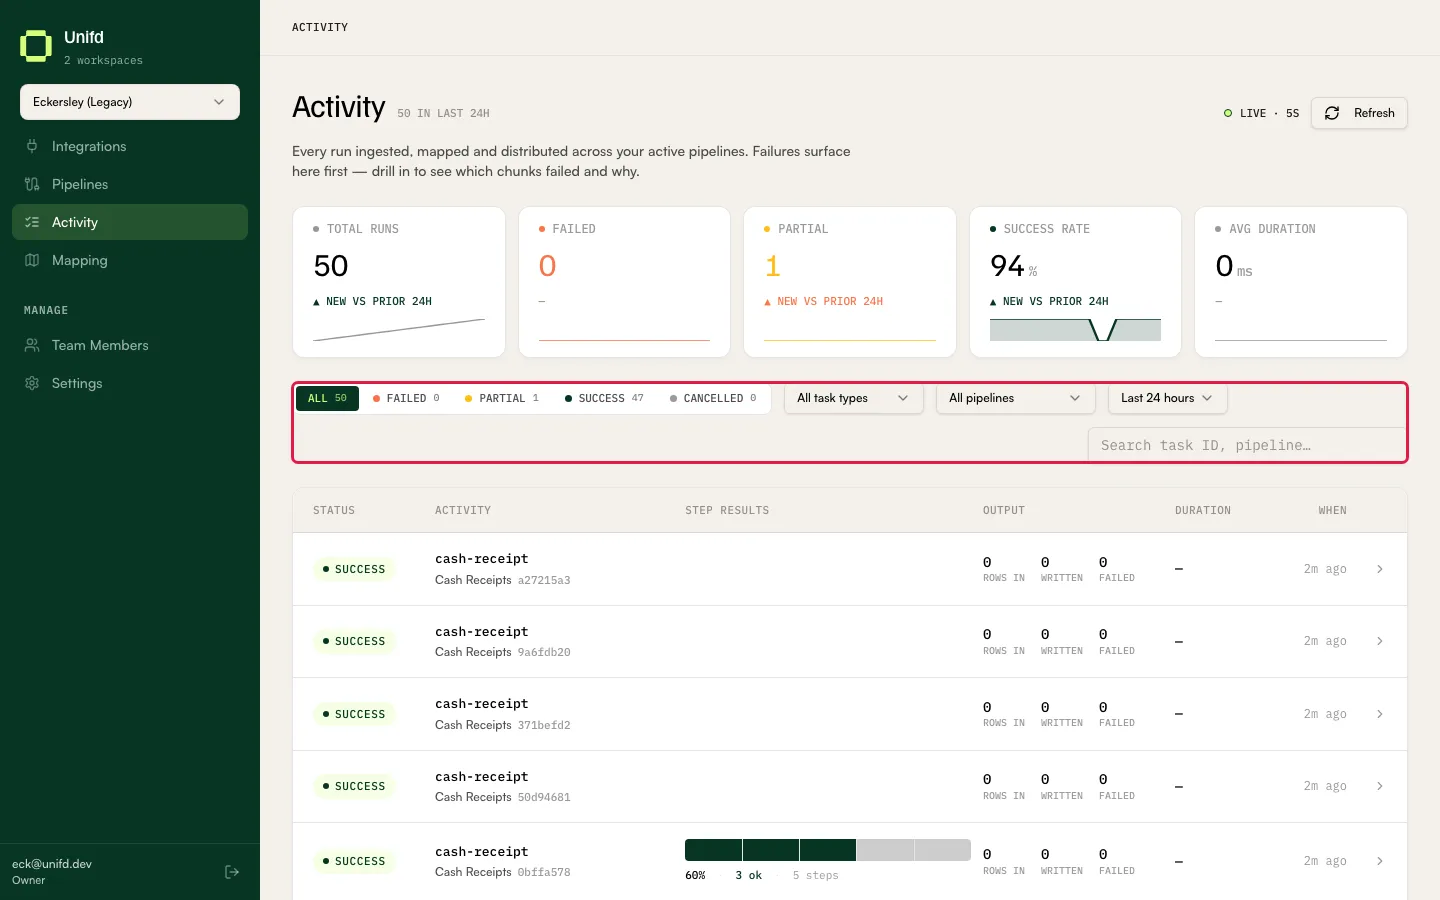
Chips filter by outcome and carry a count each: All, Failed, Partial, Success, Cancelled.
Three dropdowns narrow it further — All task types (the kind of run), All pipelines, and the time window, which starts at Last 24 hours. The search box matches a run’s ID or pipeline.
Widen the time window before concluding a pipeline has not run. The default only looks back 24 hours.
Reading a run
Section titled “Reading a run”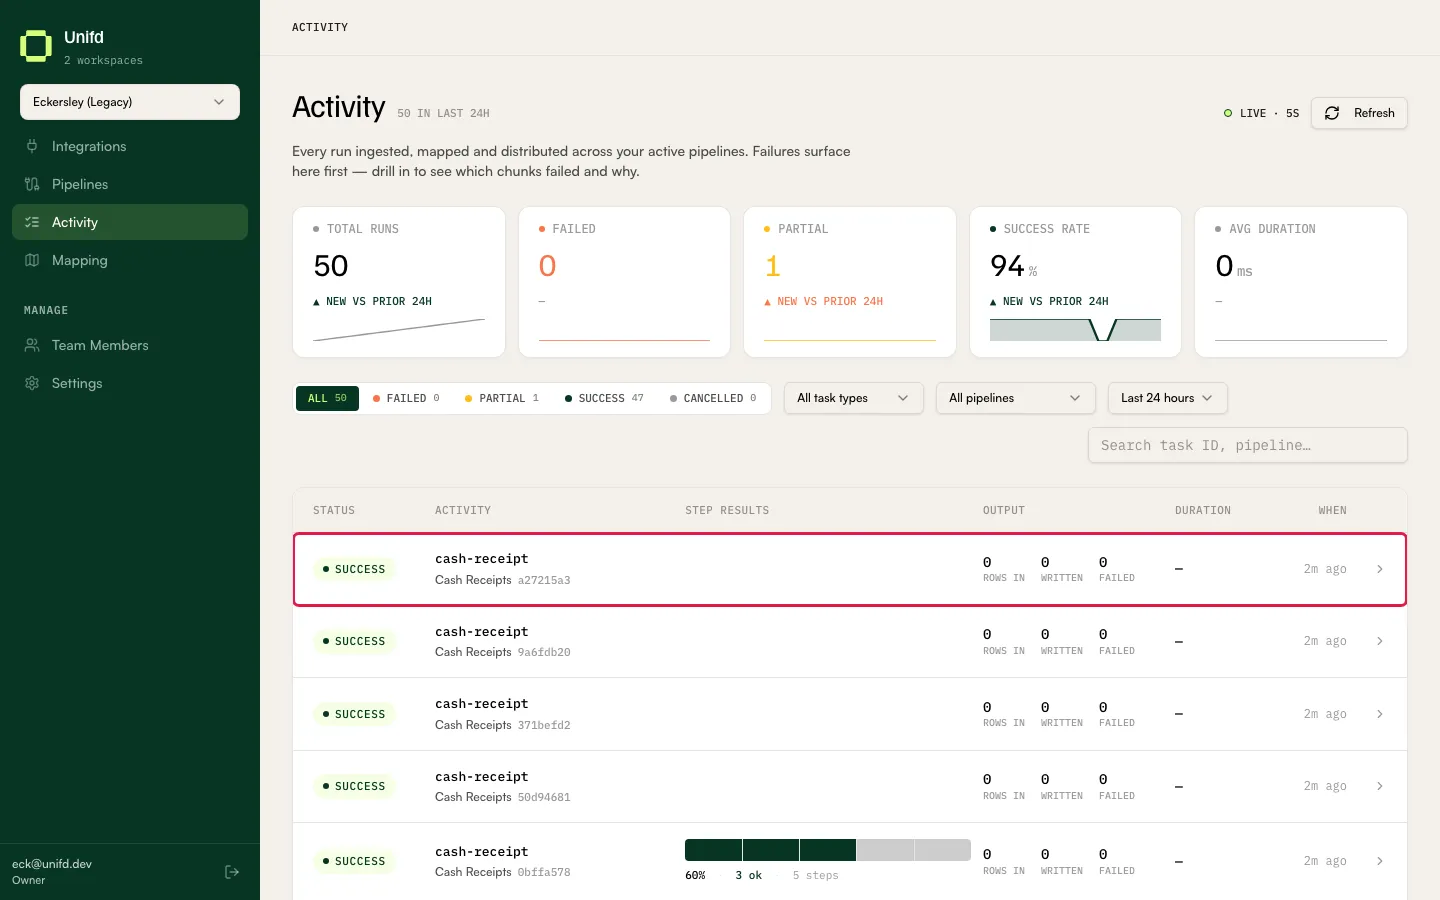
Each row is one run:
- Status — a pill: Success, Partial, Failed or Running.
- Activity — the kind of run, then either
source → destinationor just the pipeline name, then the run’s short ID. - Step results — a bar plus a summary such as
100% · 7 ok · 7 steps. Each segment is one step, coloured by outcome. - Output — three figures: Rows in (records read from the source), Written (records that reached the destination), and Failed.
- Duration and When.
The three output figures are the quickest health check. Rows in equal to Written with zero failed is a clean run. A gap between them is what makes a run Partial.
The kind of run tells you what it was doing — for example product-sync,
inventory-sync, fulfilment-delta-poll or cash-receipt.
Drilling into a run
Section titled “Drilling into a run”Select a row to open the run’s detail panel.
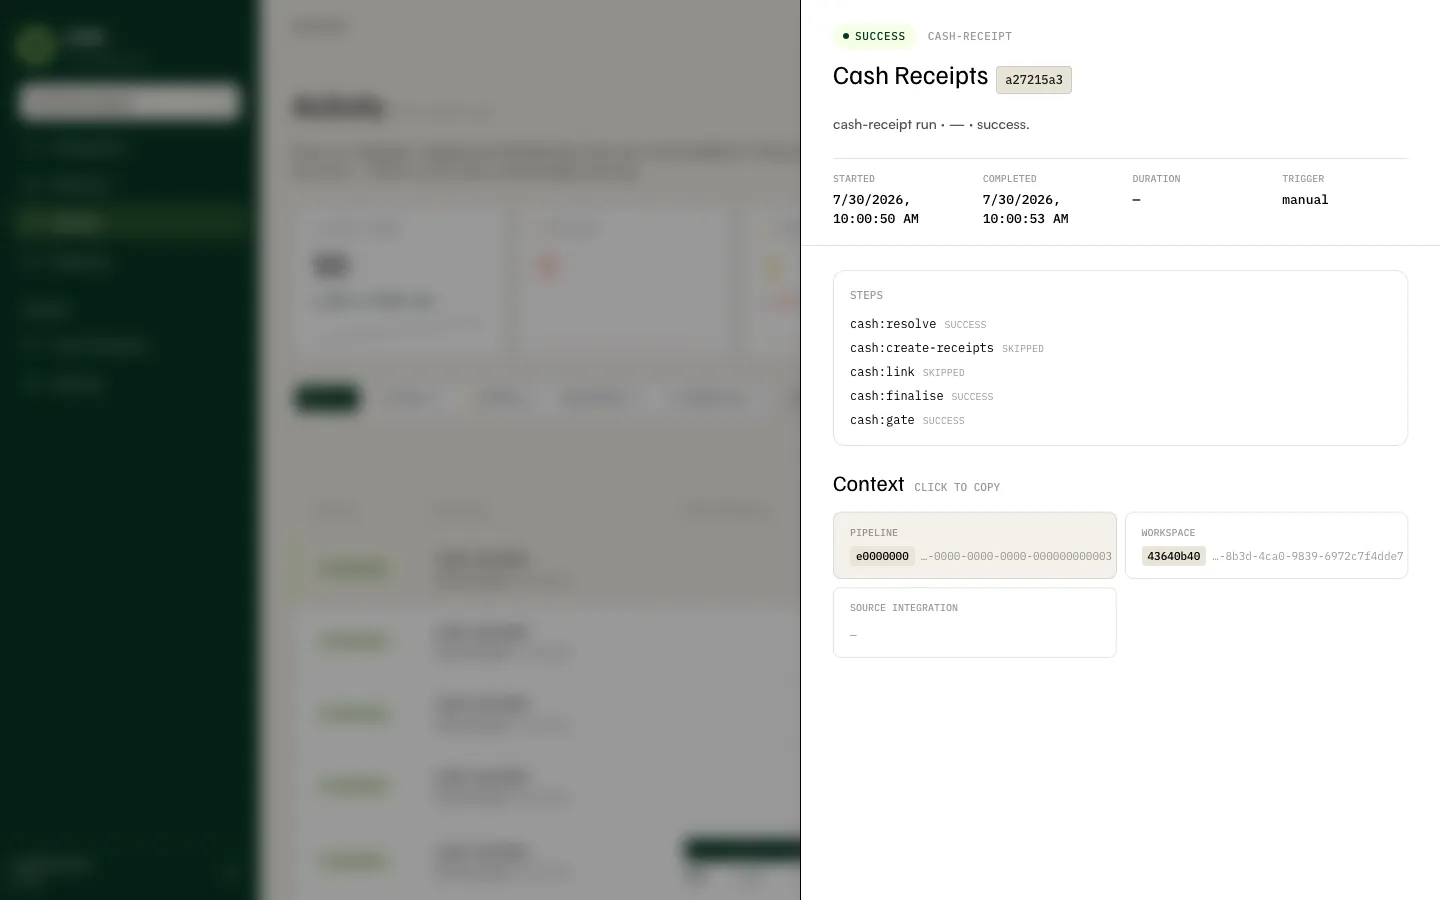
It opens with the run’s status, kind, pipeline and short ID, then a one-line summary such as “cash-receipt run · — · success.”
The facts
Section titled “The facts”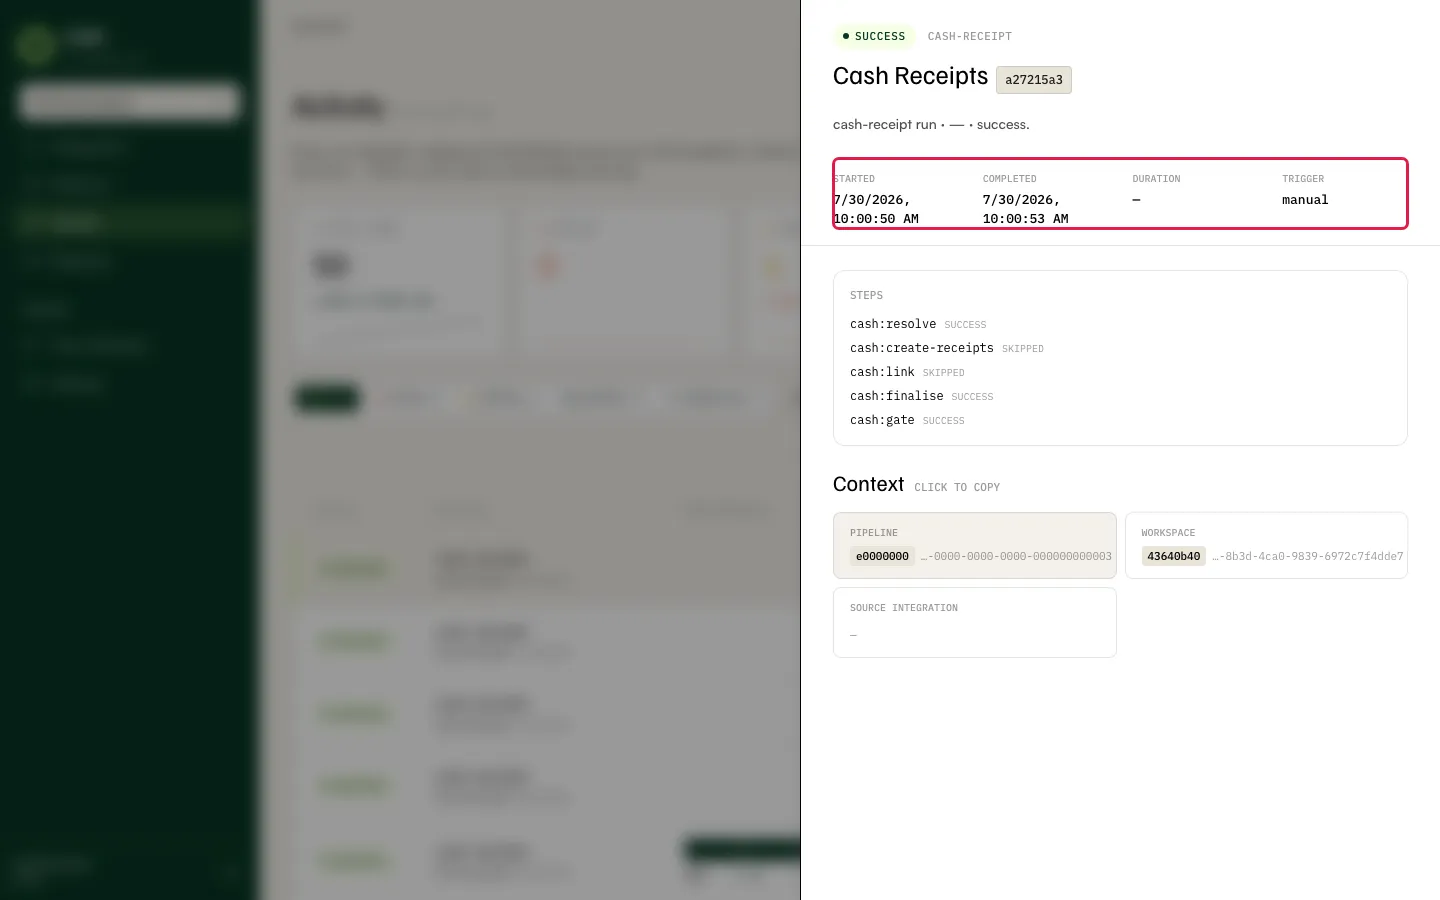
Started, Completed, Duration and Trigger. Trigger tells you how
the run began: cron for a scheduled run, manual for one somebody started by
hand.
On a run that is still going, Started has a time while Completed and
Duration both read —.
On a failed run, an Error block appears here with the reason and a code — for
example UPSTREAM_TIMEOUT: Source system did not respond within the time limit.
What the run actually did
Section titled “What the run actually did”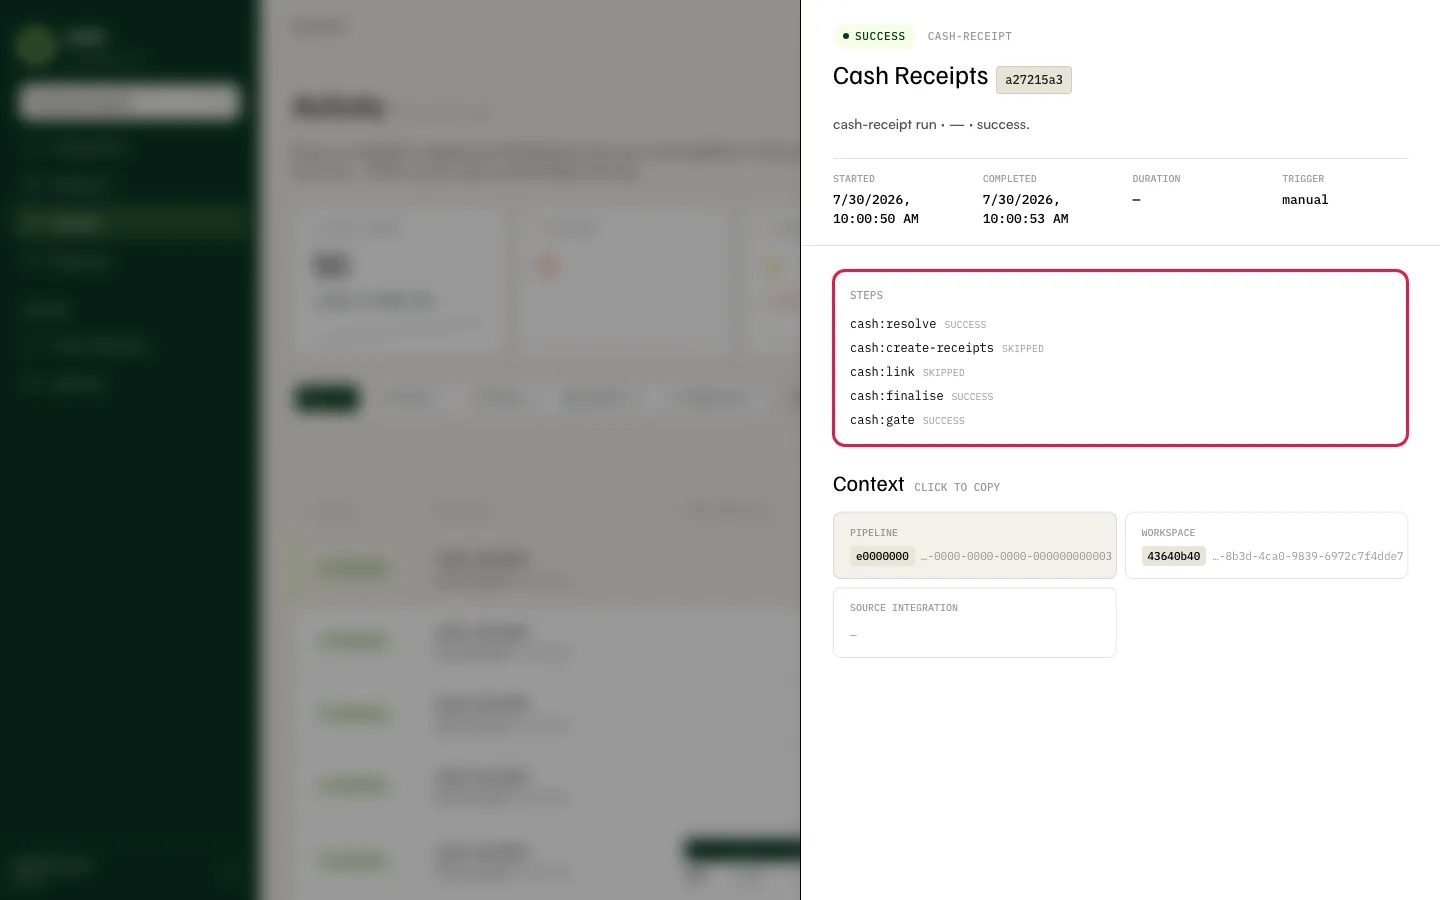
This section takes one of two forms, depending on the kind of run.
Phases. Product and stock syncs are broken into named phases, each with a
letter badge: Extract, Prune, Diff, Resolve and Distribute.
Each phase shows how many of its steps succeeded, how long it took, and counts
such as 5,600 rows.
This is what tells you where a run went wrong. If Extract is clean and Distribute reports a failure, the data was read correctly and the problem is at the writing end. On a failed or still-running run, the phases after the current one show no counts at all — they have not run.
Where work is split into chunks, a phase breaks them down into Success, Partial, Failed and Skipped, and you can hover any chunk for detail.
A flat step list. Other kinds of run — fulfilment and cash-receipt polls, for
example — simply list their steps with a status each, such as cash:resolve SUCCESS and cash:create-receipts SKIPPED. A skipped step is normal: it
means there was nothing for that step to do.
Failures. When a run has failures, identical errors are grouped with a count,
so 143× Inventory item not found at destination location tells you one problem
affected 143 items, not that you have 143 problems.
Context
Section titled “Context”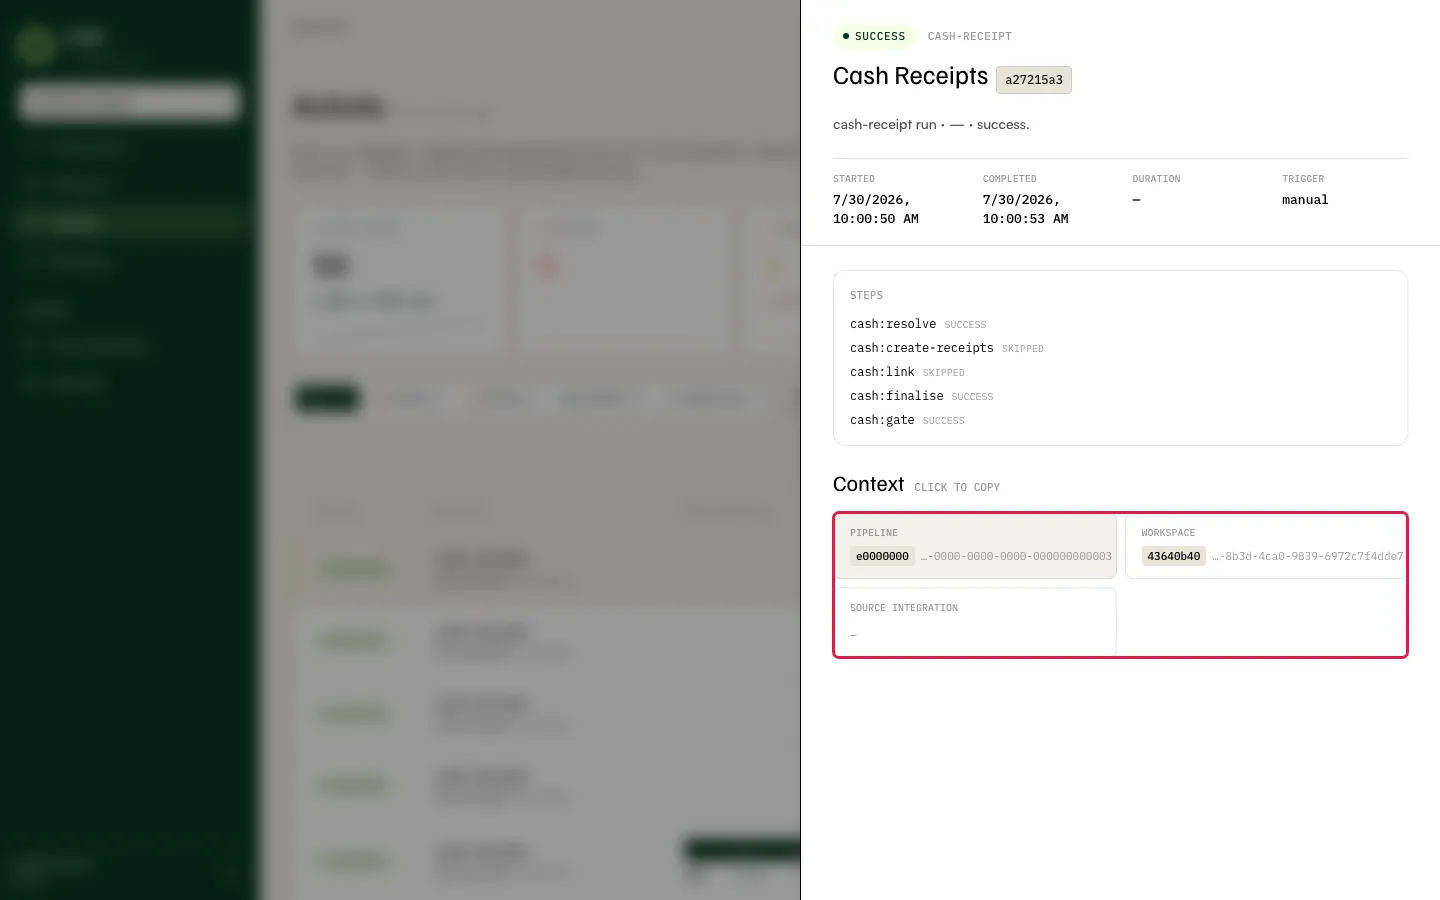
The identifiers for the pipeline, workspace and source integration, which you can click to copy. Include these if you are raising a run with your Unifd contact.
When a run fails
Section titled “When a run fails”- Open the run and read the Failures section — one grouped message usually explains everything.
- Note which phase or step failed. A failure while extracting points at your source system; a failure while distributing points at your storefront, or at the data being rejected.
- If it is a rejection, fix the underlying record in your source system, then re-run. For products you can retry individual rows — see Checking your products.
- If it is a timeout or the source did not respond, the next scheduled run will usually pick it up. You can also run it now from Schedules.
- If it keeps failing, send your Unifd contact the run’s short ID and the copied context.
A Partial run is not a failure to ignore. It means most records went through and some did not — the ones that did not will stay stale until the problem is fixed.